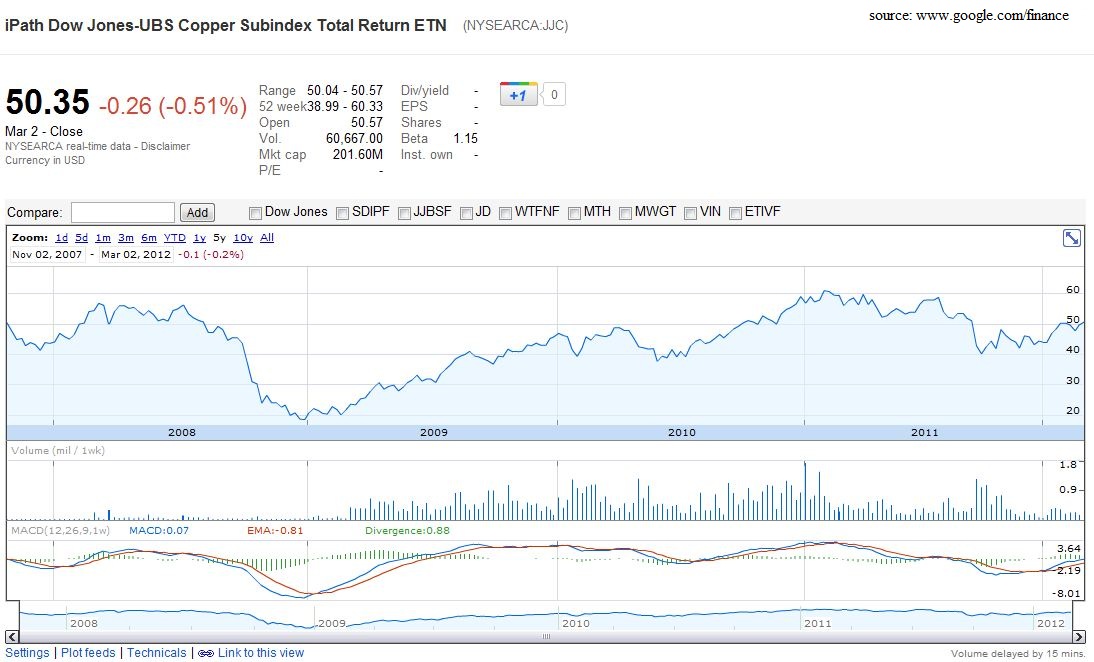
When evaluating the macro economy there are a few key indicators to look at. Lately I discussed the Baltic Dry Index and it’s lagging growth, now I want to touch on a even more telling indicator, Copper. Copper tells us about global growth and should be used as a telltale sign of where the financial markets should be and where they are headed. Below is a graph that tracks the price of copper through a ETN. Look and be amazed.
The above image tells us a few things. First off, the rally of late may not have solid footing at all. We have seen some growth in copper, but not what is to be expected with the markets acting like they are. For the financial markets to be on track for new highs, as many experts are claiming; Wouldn’t you expect a a little more out of copper? Secondly, it is time to take a close look at the BRIC countries. The BRIC’s have given us substantial growth over the past ten years, and their current global growth may not be what we expect. As copper is telling us, the global growth picture is obviously slowing, which in turn will have an impact on global U.S. companies. This is something to keep an eye on as we go into the next round of earning, as we know there are also sustained economic problems in Europe.


